Project 1A: Build Checkpoint
Deliverables
Build Checkpoint – 5 points – due Friday, January 16th, 11:59pm
Getting Started
Repository Setup
Fork the class-specific repository into your personal GitHub account. After forking, ensure GitHub Actions are enabled for your fork by clicking the green button under the Actions tab.
Warning
Even though this project is based off of an active open source project, we have made significant changes to ensure its suitability for our class. As such, be sure you are forking off of CMU-313/NodeBB and direct any questions to course staff. Do not contact the maintainers of NodeBB for assistance with your homework questions.
Development Environment
We provide an official VS Code DevContainer for this project. It gives you a fully configured environment and makes it easier for the course staff to help you.
Support Policy
We will only guarantee support for the DevContainer setup. You may choose to install and run the project natively, but you will be responsible for resolving environment issues.
Prerequisites
- Docker
- Visual Studio Code with the Dev Containers extension
- Ubuntu WSL2 (if using Windows)
What is Docker?!
You may be overwhelmed by the presence of this (maybe) unfamiliar tool, or maybe just curious about its functionality. Do not fear! We have put together a Development Tools Guide where we cover the basics of Docker and other tools used for this project!
Installation
-
Clone your fork to your machine. If you are using Windows, you should use
gitfrom inside WSL2.git clone https://github.com/<your-username>/NodeBB.git cd NodeBBWindows WSL2 Warning
For Windows WSL2 users, you should store your project files on the same operating system as the tools you plan to use. When it comes to cloning the NodeBB repository, it means that you should clone it in:
- the Linux file system root directory:
\\wsl$\Ubuntu\home\<user name>\ - NOT the Windows file system root directory:
/mnt/c/Users/<user name>/$orC:\Users\<user name>\
You can use
% cd ~to access the Linux home directory, then clone the repository there. - the Linux file system root directory:
-
Open the repository directory in VS Code. (Be careful not to open a parent directory, otherwise VS Code will not pick up the DevContainer configuration.). You can double check that you are in the right directory by seeing that
.devcontaineris at the top level (rather than below anodebbdirectory, for example).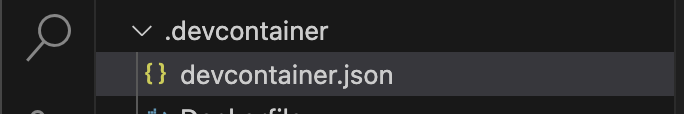
-
Once you have the right directory open in VS Code, choose “Reopen in Container” when prompted (bottom-right). Alternatively, open the Command Palette (
Ctrl/Cmd+Shift+P) and run “Dev Containers: Reopen in Container”.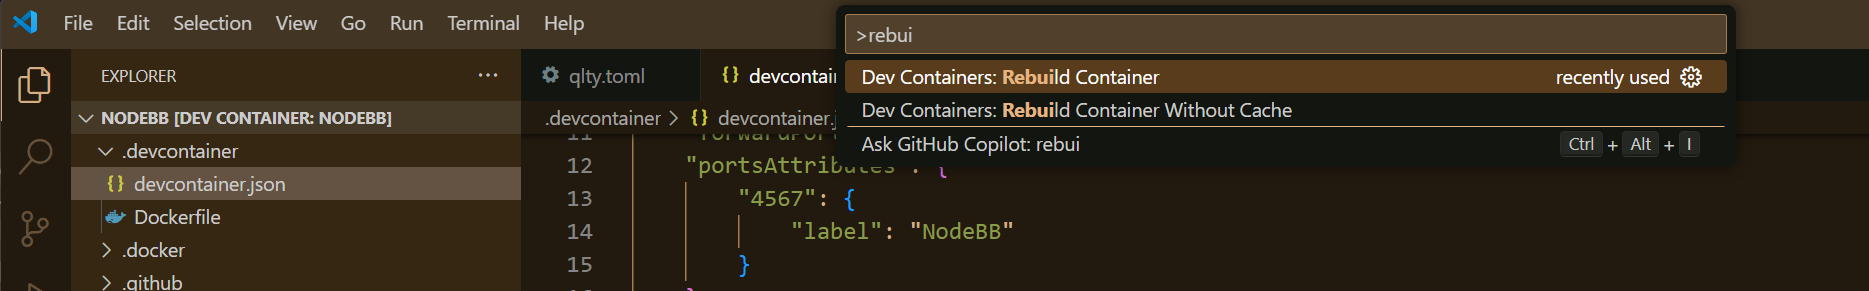
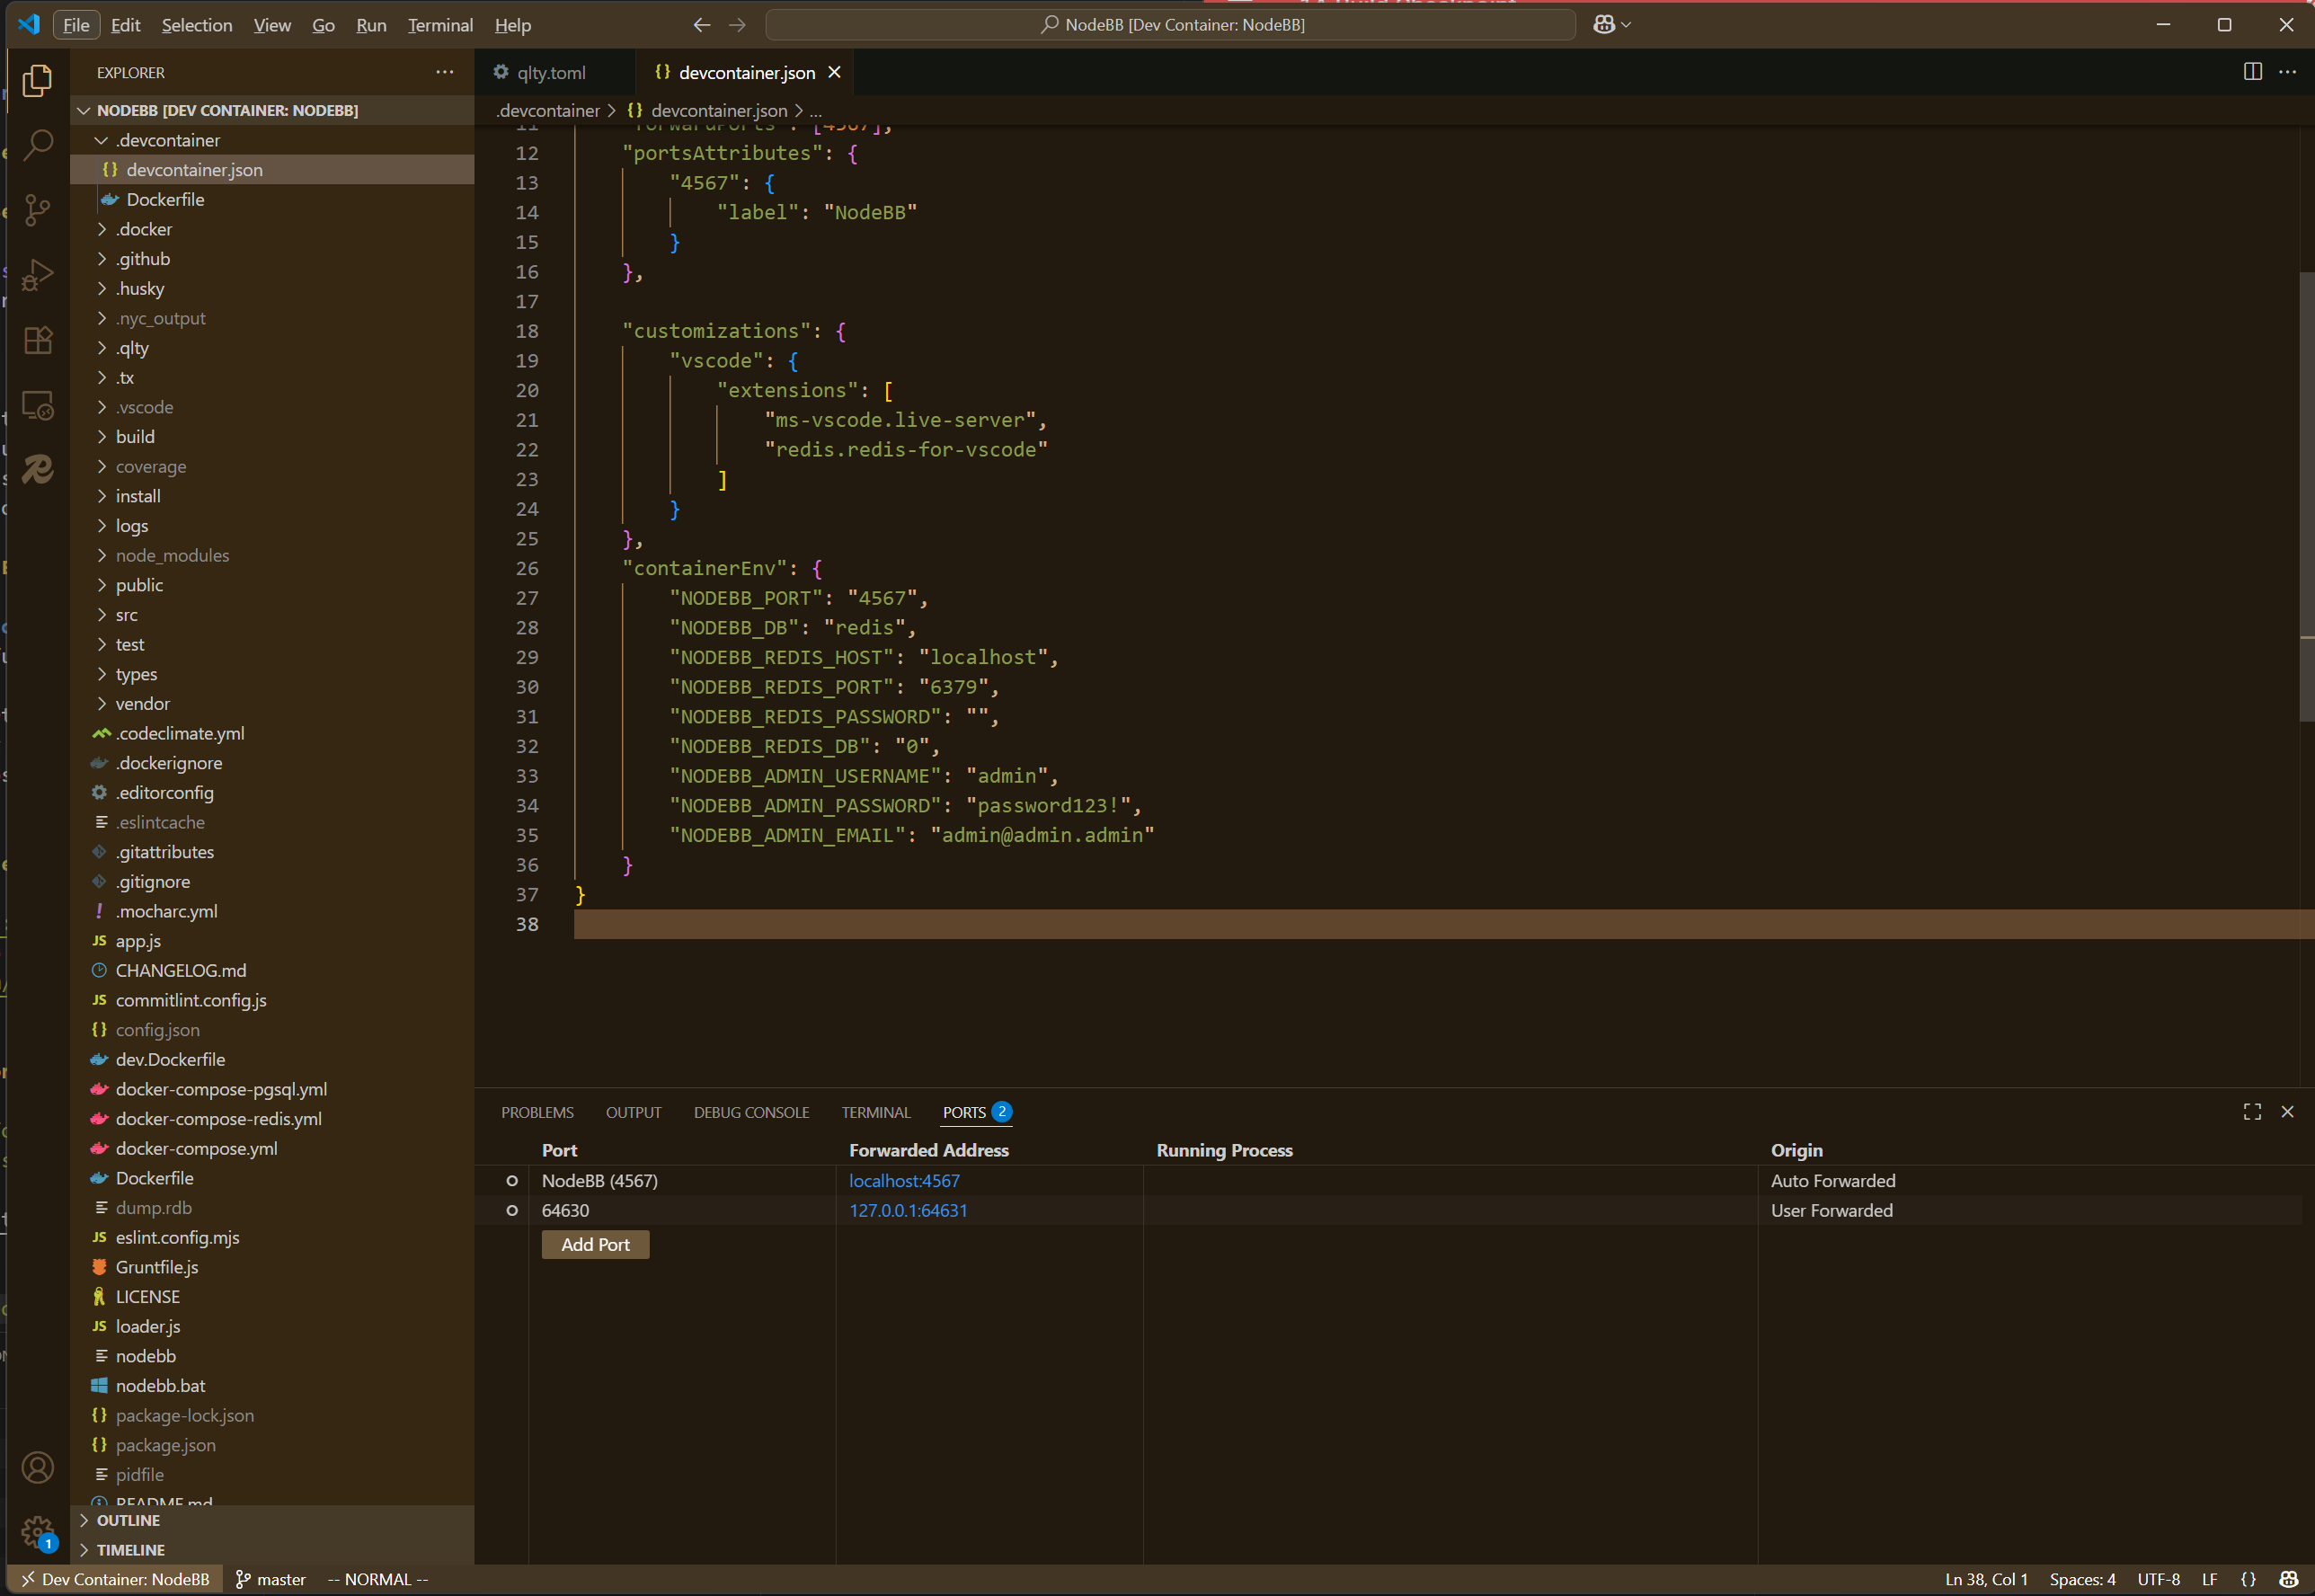
To double check that you have built the right DevContainer, you can open up the Command Palette and run “Dev Containers: Open Container Configuration File”. The file should look similar to the one below. Specifically, the
nameshould beNodeBB.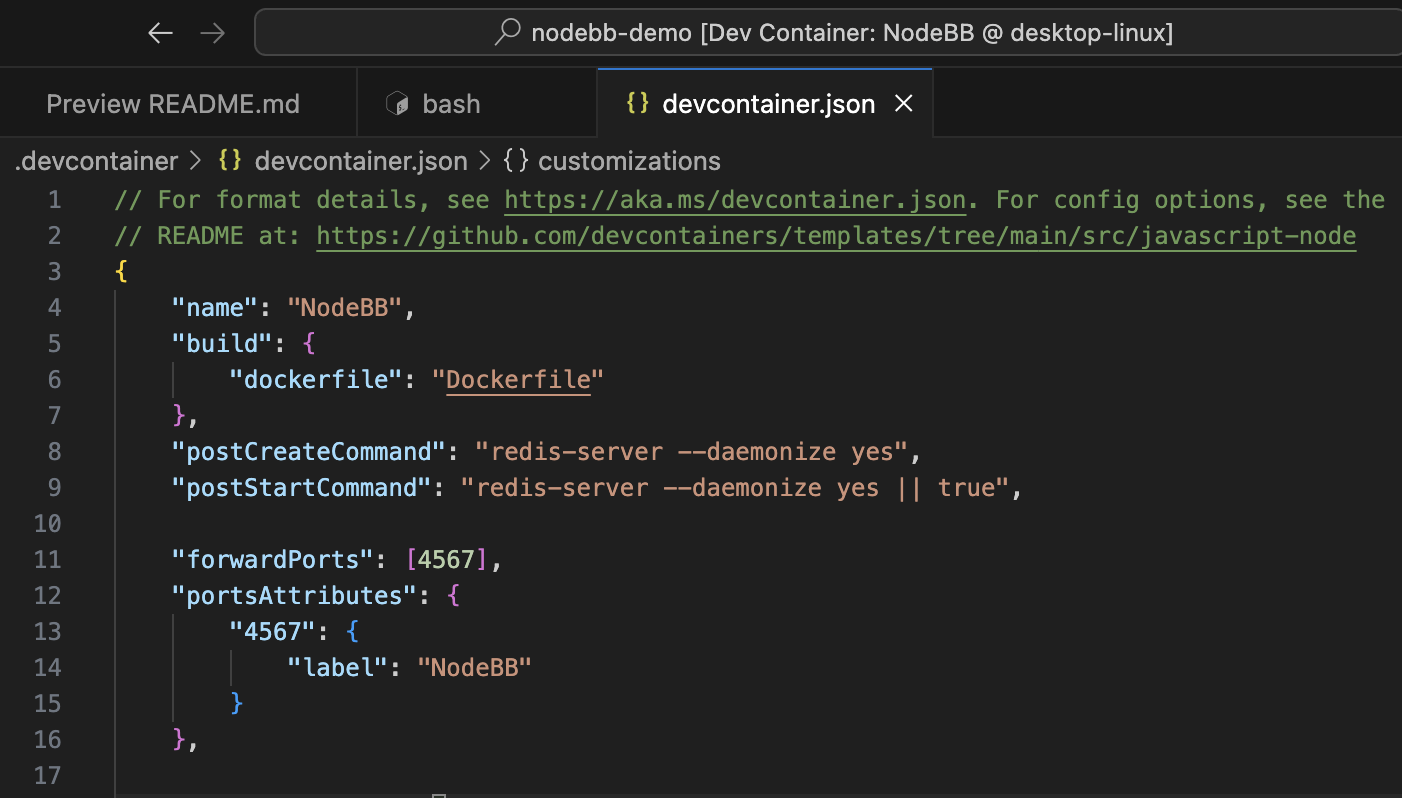
-
The container will take a few minutes to build the first time. Confirm that installation was successful by checking the
nodeandnpmversions from the integrated terminal: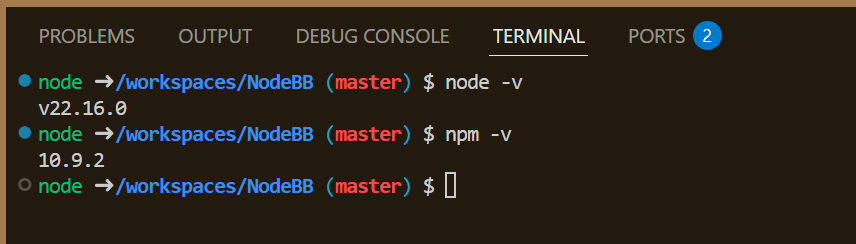
-
Setup your NodeBB installation via the integrated terminal using the command below. This will use the environment variables from the DevContainer (specified in
.devcontainer/devcontainer.json). As part of the process, an admin account (admin) will be created with passwordpassword123!../nodebb setup -
Finally, you should install all of the NodeBB development dependencies via:
npm install
Launch
Start the server from the integrated terminal in VSCode:
./nodebb start
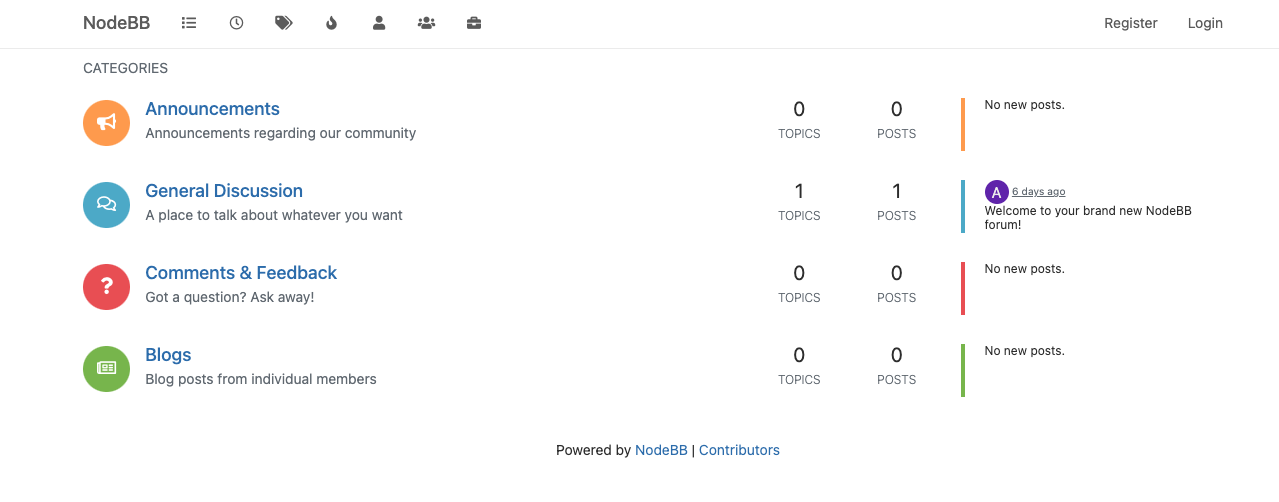
You should be able to navigate to http://localhost:4567 and see the main forum page, as shown below.
NodeBB listens on port 4567 in the container and is forwarded to localhost:4567 on your machine (configured by the DevContainer). If you need to change the host port (e.g., to avoid a conflict), use the Ports tab at the bottom of VS Code and modify the Forwarded Address:
Warning
In this class, we expect students to first try debugging errors on their own; this includes following stack traces, searching up error strings and unfamiliar outputs, etc. If you get stuck, or if installing and running NodeBB is taking more than a few hours, stop and ask for help on Slack!
Take some time to click through the pages and explore the different features that NodeBB has to offer.
To shut down the server:
./nodebb stop
You can also use the --help option to learn more about other ./nodebb commands.
./nodebb --help
Lint and Test
When working on an existing codebase, especially in a collaborative setting, we want to ensure that none of our changes introduce unexpected bugs or issues for other developers. To fulfill these goals, we often use different tools to help us evaluate our code. Luckily, NodeBB is already packaged with a number of neat tools!
You can run the linter and test suite using the following two commands:
npm run lint
npm run test
The first time you run the above commands, you may have to run npm install to fetch dependencies and also edit your config.json file to add test dependencies.
See the FAQ page for more.
After the test suite finishes running, NodeBB will also generate a code coverage report.
This report gives you measurements with regards to what percentage of the codebase is covered by the test suite.
Open the index.html file in the coverage folder to see the full report.
Coverage Report
As this is an existing codebase with a decently-sized test suite, you should expect to see a relatively high percentage of coverage, i.e. the majority of the bars/cells displayed should be green.
If you are seeing a lot of red bars, it may mean that the test suite was not run properly. Double-check that all of the tests passed and that there were no failures.
More on Analysis Tools
A linter is a tool that directly analyzes your source code for common errors. A test suite is a set of test cases that you write for a software program to show that it has some specified set of behaviors; our testing tool provides a framework to structure our test cases, runs the test suite, and generates a report of which tests pass/fail.
We will do a more in-depth exploration of analysis tools later in the course. For now, just know that these tools exist for you to use in evaluating your code.
Deliverable: Build Checkpoint (5 pts)
Upon completing the above steps, take screenshots of
- the home page of NodeBB, and
- the coverage report generated by the coverage tool
opened in your browser.
Be sure the URL is clearly visible in both screenshots (i.e. localhost:4567 and the file path to your coverage file), so we can confirm that you have everything running locally.
Submit the two screenshots to Gradescope.
Grading
To receive full credit for this checkpoint, we expect:
- A Gradescope submission of two screenshots showing a local running build of NodeBB and the coverage report within a browser